6. Randomization, Input, and Feedback
Completion requirements
In this tutorial, we use random numbers to graph a random linear function (random slope and random y intercept), receive input from the user, and give feedback if the answer is correct or not. The expected output of this tutorial is shown below.
Expected Output
1. Graphing a random linear function
To generate a random slope and a random y-intercept, type the following in the Input bar:
a = randombetween(-5,5)
b = randombetween(-5,5)
To draw plot the graph, type the following in the Input bar.
f(x) = ax + b
The randombetween(a,b) command generates random integers between a and b where a < b.
2. Generating new random linear functions
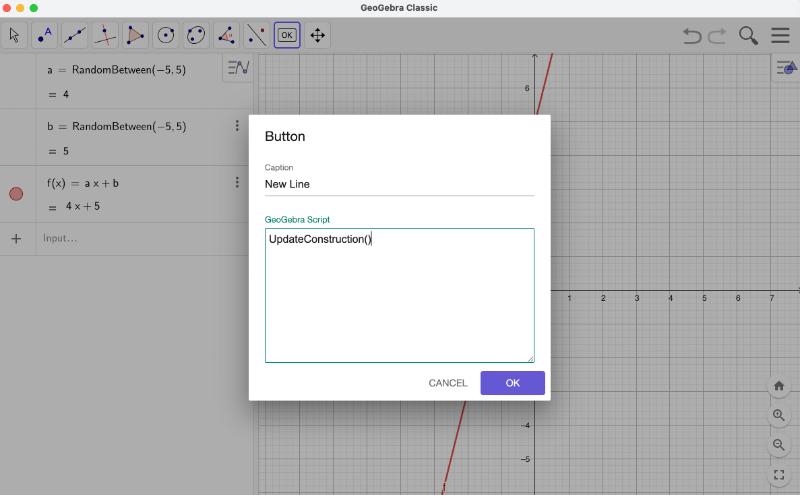
Now that we have a linear function graph, we need a button to create new random lines.
- To create this button, select the Button tool from the Toolbar, and then click on the Graphics view.
- In the Button dialog box, type New Line in the Caption text box, type UpdateConstruction() in the GeoGebra Script textbox, and then click on the OK button.

3.) Receiving input from the user
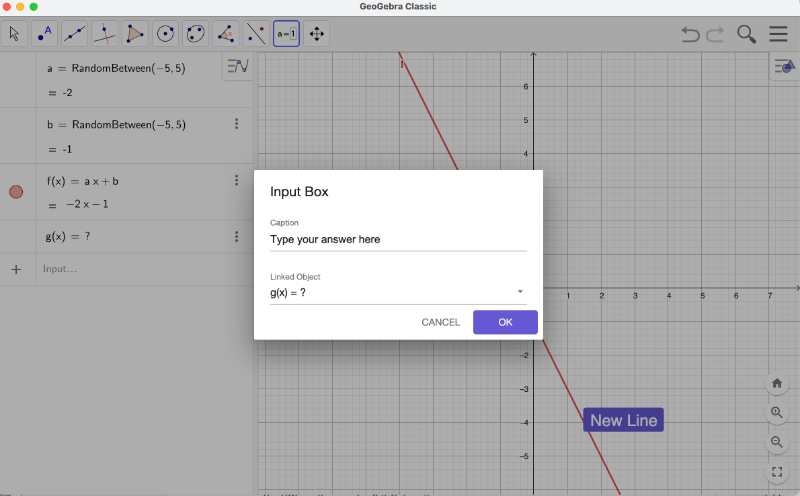
We now let the users guess the equation of the linear function graph. They will use the Input box to type their equation. To construct the Input box, do the following
- In the Input bar, type g(x) = ?. Here, g is undefined and will store the equation from by the user.
- From the Toolbar, select the Input box tool and then click on the Graphics view.
- In the dialog box, type Type your answer here: in the Caption box, select g(x) = ? in the Link Object box, and then click the OK button. You can move the Input box by selecting the Move tool and then dragging it while holding the right mouse button.
- Type the equation of a linear function in the Input box. Notice that this will replace the ? symbol as the equation for the function g.
- Every time we click on the New Line button, we need to set the value of the function g to undefined, so we add the code g(x) = ? below the UpdateConstruction() script in the New Line button. You can edit the script by right clicking on the New Line button, selecting Settings and then clicking on the Scripting tab in the Settings panel.

4.) Comparing the function with user's answer
To compare the user's answer g to the given function f, type the following in the Input bar.
iscorrect = f == g
5.) Giving Feedback
We will write two feedback texts for students. The feedback for the correct answer will appear if the variable “iscorrect” is true, otherwise the incorrect answer feedback will appear. Below are the text that will appear if the students' answer if correct and incorrect.
Text1: You are correct! Good job!
Text2: That is incorrect. Please try again.
To create the feedback text, do the following:
This command returns “true” if the user's answer equals the given function, otherwise false, and then assigns the value to iscorrect. Note that iscorrect is a variable, you can replace it with other letters or words.
- Create two texts using the Text tool and type the two feedbacks above, one for each textbox.
- Right click on Text1, select Settings, and then select the Advanced tab in the Settings panel. In the Condition to Show Object text box, type iscorrect == true. This means that it will show Text1 if the answer is correct.
- Use the same steps for Text2 but set the Condition to Show Object as iscorrect == false.
- Note that Text2 will also appear when the New Line button is clicked (Why?). To solve this problem, type isgdefined = Isdefined(g) in the Input bar. This command returns true of g is defined, otherwise, returns false.
- Edit the Condition to Show Object of Text2 to iscorrect == false ^ isgdefined == true. This means that Text2 will only show if the user has typed the answer and the answer is incorrect.
Last modified: Friday, 26 January 2024, 5:52 PM


