
Try
Topic outline
-
This course is part of a sequence of platforms to explore the outcomes of the Erasmus+ project AuthOMath:
- Click Inform for exhaustive information about the AuthOMath's aims, activities, and people.
- Stay here on Try for trying existing digital math tasks made possible with Authomath.
- Click Tinker for programming your first own digital math tasks.
- Wait for Use, which will be a platform for courses for use in math teacher education.
- Click on Create to learn about how to set up your own STACK server for creating learning material for your classes.
Each question is first introduced with comments on the didactic ideas that guided the use of GeoGebra and STACK here, then followed by a quiz for trying the partner's questions
Below you find four sections, each with questions from one of the four partners of the AuthOMath project. -
-
Exercise 1 : Addition of fractions
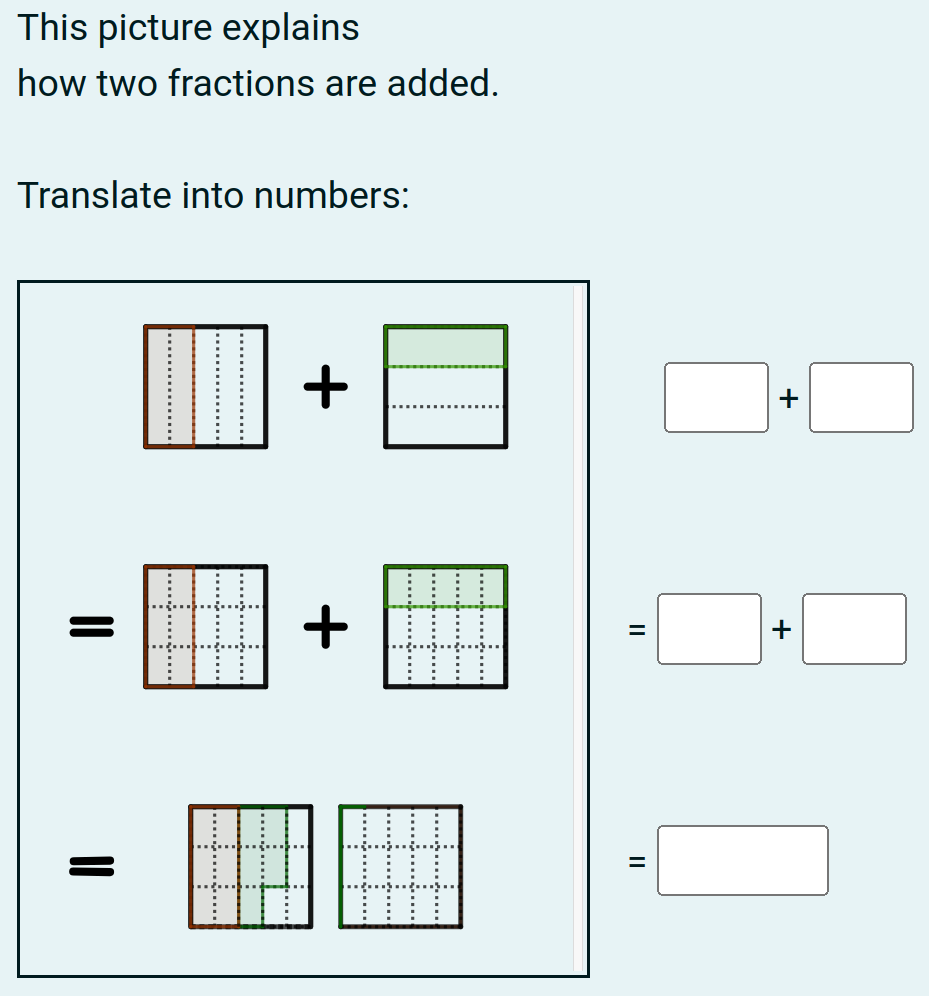
When completing this task, learners reflect on the procedure for adding fractions. To do this, GeoGebra is used to provide a static pictorial representation of the process, which must be translated into formal maths.
The pictorial representation is based on the idea of a fraction as part of a whole. It is not only part of the task itself, but also part of the feedback area of STACK. Depending on the learner's answer, translations of individual steps are displayed here to encourage learners to work out the rest for themselves.
After a certain delay, a detailed solution is made available.Task 2 : Quadratic functions and graphs

The subject of this task is the well-known translation of an algebraic expression into a geometric representation.
Here GeoGebra offers an interactive applet both in the STACK task and in the feedback. The latter takes place in three steps, each after a certain delay:
- Firstly, it allows learners to compare their incorrect solution with the correct one, giving advanced learners an immediate indication of the mistake that was probably made by mistake
- For those who need more help, it provides an interactive version of the situation combined with questions to help learners work out for themselves how the algebraic expression relates to the graph.
- Finally, a model solution is made available to suit all learners who need a step-by-step guide to solving tasks of this type.
Task 3 : A fraction as part of a whole
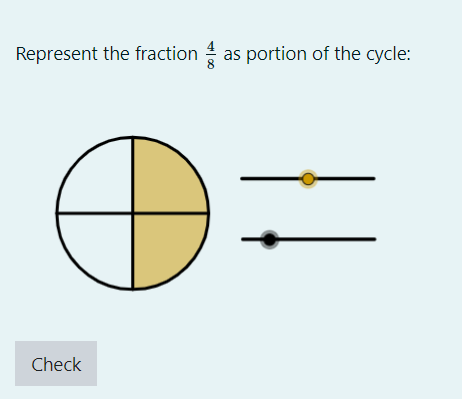
This task, which is familiar from various textbooks, represents a fraction as part of a whole.
However, while printed books are "by nature" static, GeoGebra enables a dynamic and interactive approach here, which is randomised within the framework of a STACK task. If you get the task wrong, the first feedback is just a hint. If this is sufficient, you can repeat the task with new values. Or you wait for the full solution
A special case is that the learner enters a fraction that is equivalent to the expected solution. In this case, the learner receives feedback that he or she has not worked on the task according to the scheme suggested by the representation, but may have made an interesting discovery...
Now try these tasks below.
Login or create an account first, if you haven't one yet.
-
-
-
Task 1 : Create angle as a right angle
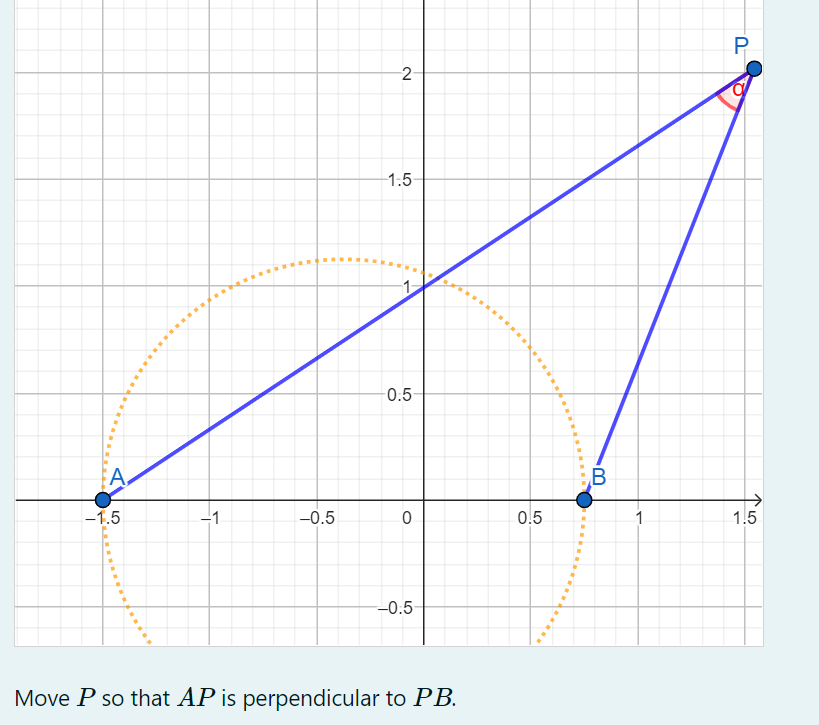
This task asks the learner to think about when two line segments are perpendicular. They then need to relate their understanding of this technical term to circle theorems, and the converse of circle theorems. GeoGebra is used to provide a visual representation, and the position of the point \(P\) constitutes the student's answer.
In this problem, the position of points \(A\) and \(B\) are randomly generated.
Task 2 : Create a function by sketching its graph
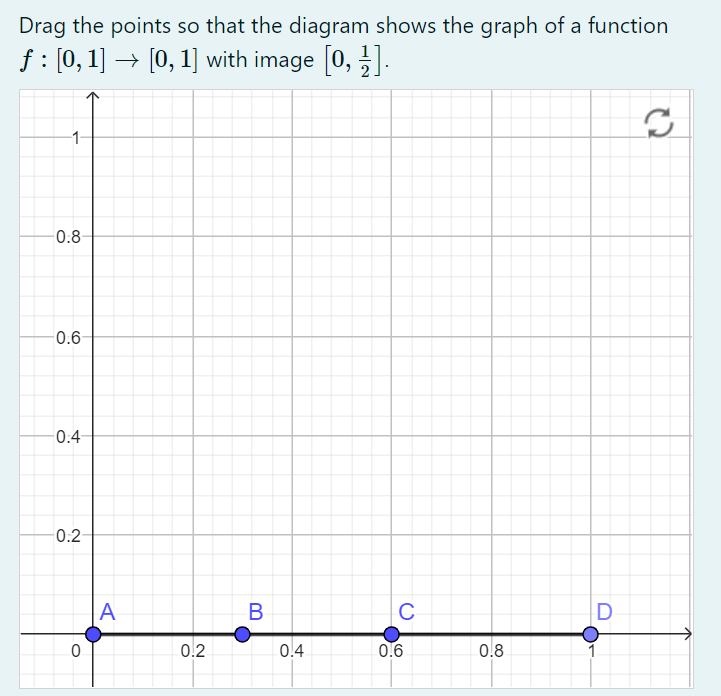
This task asks the learner to think about the range and domain of a function. They can demonstrate their understanding of these terms by sketching the graph of a function.
GeoGebra is used to provide a visual representation of the graph of a simple piecewise function, and the position of the four points on the worksheet define the ends of the segments of the function.
This problem provides a starting point for a whole range of similar problems exploring the properties of functions.
Task 3 : Illustrate the position of eigenvectors
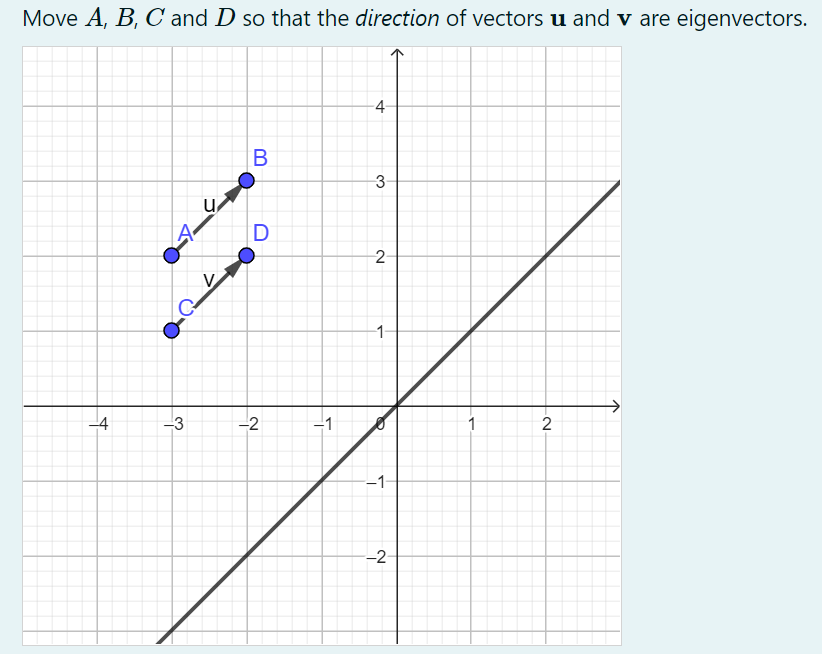
This task is from more advanced, university level, mathematics. Eigenvectors is a technical term for vectors which are scaled by a transformation, but remain in the same direction (or reverse direction). Understanding the effect of transformations through calculating eigenvectors is an important topic in vector spaces.
Students get very adept at calculating eigenvectors through a mechanical procedure, but their geometric understanding can remain fragile.
GeoGebra is used to provide a visual representation of the vectors.
In principal this problem could be extended to a wider range of 2D transformations.
Now try these tasks below.
Login or create an account first, if you haven't one yet.>
-
-
-
Task 1: Cubes

This task addresses a widespread misconception, even among pre-service teachers, when considering that two figures should also have equal surface areas because they have the same volume. Hence this task provides two learning opportunities: First, students learn from the given example, that two figures of the same volume indeed can have different surface areas. Second, students reflect on the potential of their own learning experience for teaching their future pupils.
As a one-time learning opportunity, this task is not randomised. GeoGebra has been used here to allow the figures to be rotated. This task of reflecting on the didactic potentials of one's own learning progress is part of an ongoing research project at the UC.
Task 2: Area

Similar to the task above, this task also provides an opportunity to reflect on the didactic potential of one's learning progress.
The figure shows the first part of the tasks, where university students are asked to compare the area of two figures formed with tangram pieces without using a unit of measurement. They use an applet where they can place the parts of one image onto the other, hence showing that both figures have the same area but different forms.
In the second part of this task, they have to use a different strategy, which is taking the small triangle of the tangram as a unit of measurement for an indirect comparison of both areas. With this task, they are able to explain the independence between the area of a figure and its form.Task 3: Linear equations
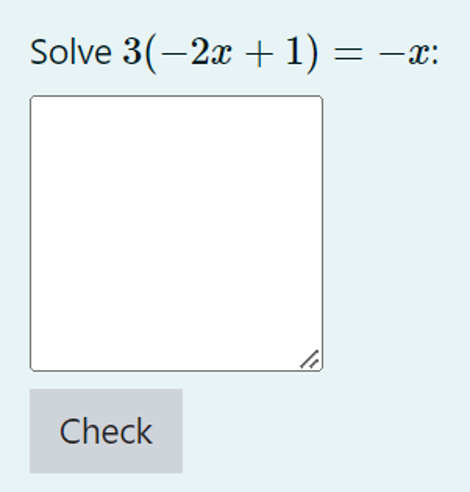
This task makes no use of GeoGebra. Instead, it concentrates on exploring STACK's ability to design differentiating, adaptive feedback to a simple algebraic problem. Hence, its main focus is to provide formative comments that are specific to each of the mistakes that students could make.
Targeting specific mistakes allows students to focus on correcting them and learning from the experience, reducing their difficulties on the subject.
Now try these tasks below.
Login or create an account first, if you haven't one yet.
-
-
-
Task 1: Factorising I
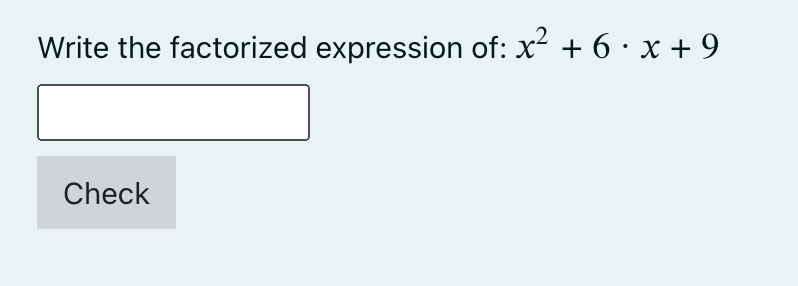
The following two tasks need to be seen as two steps in a learning sequence. Here, the object of this task is to introduce the factorization of a square of a binomial.
If students write a wrong answer, they get feedback with an interactive GeoGebra applet. It shows a square that is composed of four rectangles, that show an equivalent structure of the given algebraic expression. Open to interaction, the student is invited to explore how lengths of the square and its structured area relate, thus helping him to find out a strategy to factorize squared binomials.
Task 2: Factorising II
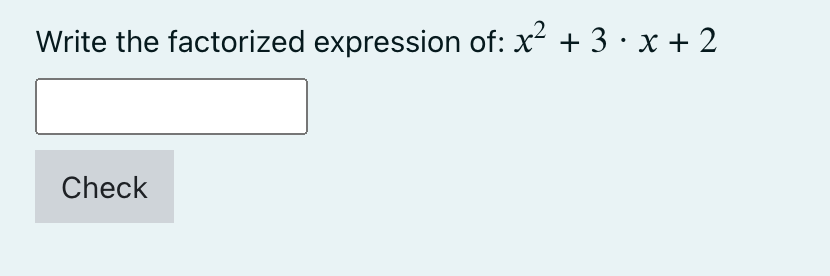
In this second task on factorising, the object of this task now is to introduce the factorization of a general quadratic expression.
In the feedback to wrong answers, again the students have the opportunity to interact with a geometric figure that helps them to find out a strategy to factorize polynomials on their own. Other than in the task above, the object of exploration is now a rectangle.
Task 3: Triange with a given Area
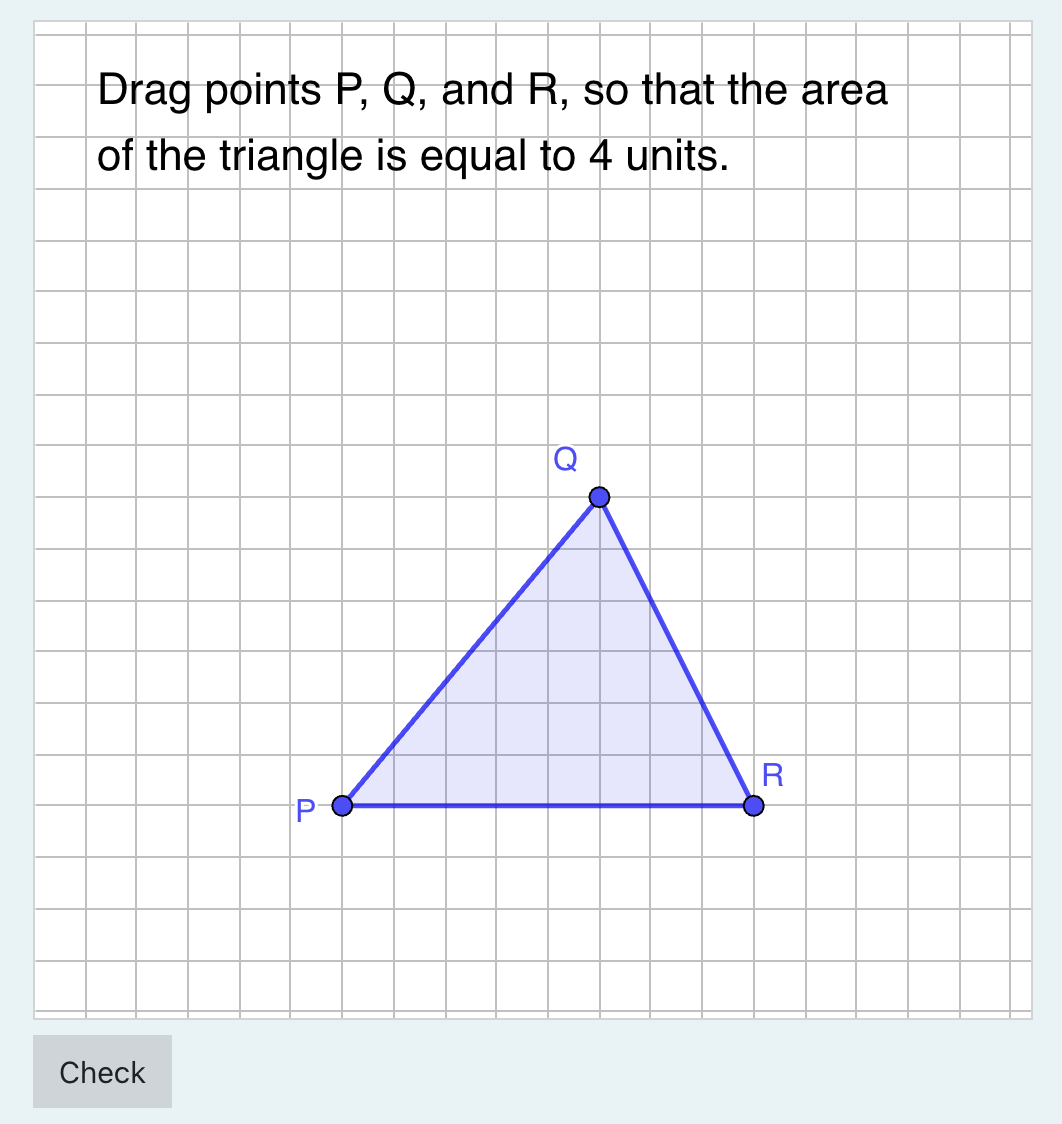
The goal of the task is to let students apply the formula for the area of a triangle and observe that triangles with equal base and equal height have the same area regardless of the shape. Students will observe that there are multiple triangles that can be created with a given area.
There are two general solution strategies for this task. First, the student can multiply the area A by 2 and then find the base and height whose product is 2A. Second, the student can use a rectangle with dimensions b x h and then use one of the sides as a base and place the third vertex on the opposite side.
Now try these tasks below.
Login or create an account first, if you haven't one yet.
-